Wow, that is stunning Michael! I’ve not spent long with it, but it seems pretty straightforward to use.
The only thought I have at this stage is how can I save a graph once I have created it? For example, I’ve just graphed the RTTA of a Killarney whistle, and I’d like to be able to give it a name and save it as say: Killarney Whistle RTTA. How do I best do that, preferably on my phone, as it’s great to be able to do this on a portable device!
(P.S. please excuse us 78 Year Olds trying to keep up with you young folk!)
I’ve updated the Chromatic Tuner and Real Time Tuning Analysis (RTTA) tool to now support both Equal Temperament and Just Intonation (with selectable root note).
If you use the ABC Transcription Tools, both of these utilities are part of the offline cache, so to pick up the new versions, you’ll need to update to the latest version of the tool:
3152_012126_1800
The version number is displayed at the bottom left of the “Settings” dialog in the standard editor.
If your version starts with a number less than 3152, click the version number to do a manual update of the tool then do a hard refresh of the page.
All the processing is done in Javascript locally in the browser for both the Chromatic Tuner and the Real Time Tuning Analysis tool. There are no servers involved at all.
If you use my ABC Transcription Tools, with the latest update both tools get installed in the offline asset cache and will run offline.
The source code is in my GitHub repo, link to it at the bottom of the Instructions dialog (click the ? at the top left of the tool).
Ha ha, I had a similar experience. Halfway through assembling an RTTA, the phone rang and I answered it. As we talked on the phone I realised I was racking up spurious data.
And yes, I can visualise starting an RTTA, pausing to check it was going OK, and then resuming to fill out any missed parts of the spectrum.
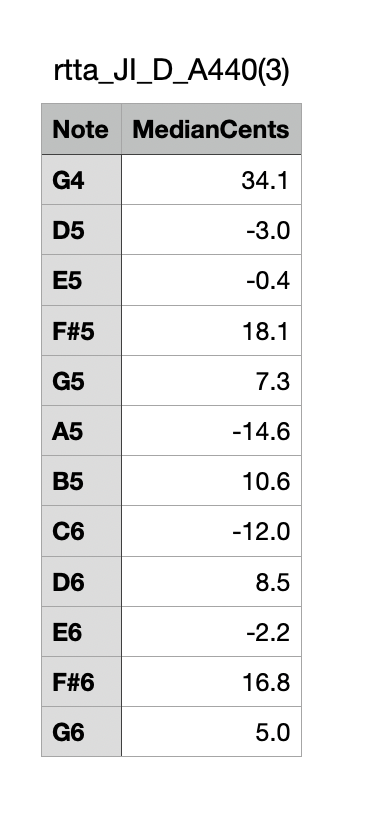
Now, when you find yourself really bored one evening, you could add another text-only output, that renders the data into a really simple list, such as below…
D5: +12
E5: +7
F#5: -13
G5: +2
Etc, etc, up to the highest note recorded, and perhaps then ending in a summary, eg:
Sharpest: D5, +12
Flattest: F#5, -13
Mean:
Any other calculated results?
Hmmm, not really sure the summary is needed! The advantage of the very simple list is how economic of space it is. And how easy to pop into a spreadsheet for any further processing. Hmmm, separating the note name and value with a tab would probably make it easier to add to a spreadsheet? And how to save it? A simple text file?
But no need to rush on that one. Just if you get bored….
Actually, I originally envisioned a CSV export option, but decided that the graph was probably more generally useful. I’ll give it some thought and see what I can come up with.
I’m heading out Saturday on trip for several days, will be back on Jan 28th so there may be a few days with no updates to the tool.
Ah, I had the same experience when I tried to do an RTTA of my Killarney whistle. I cranked the level up +12dB using the Input Level Adjustment box near the top of the App and it suddenly worked fine.
Messing around with the RTTA reminded me how much the volume levels on whistles vary between highest and lowest notes, so much more than on flutes. I closed the door and windows so as not to antagonise the neighbours on those high B notes!
So it then occurred to me that as well as trying to optimise tuning, we whistle fiddlers should also be looking to minimising level difference across the range.
So then it occurred to me we would also benefit from RTLA - Real Time Level Analysis. (Yeah, I made that term up too, just like RTTA!). Then I wondered if there was such a thing, but couldn’t bring it immediately to mind. I have a Sound Level meter, but taking down all the data is the same issue that led to the RTTA concept.
And then I thought, I wonder if the RTTA could also collect sound level data? And how would you present it? A separate graph? Another column in the CSV file?
And what would you take as reference? Would be nice to have it in absolute dBA terms but that’s probably not so easy. But perhaps not so important.
Anyway, enough to float the notion. That’s probably enough to have Michael cowering under his bed, hoping I’ll go away!
Feel free to dismiss this as the ravings of a lunatic, or technically unfeasible, or whatever. Or point me to something that already achieves the same goal!
 Tool")