Hello all,
I’ve been experimenting with some tuning analysis which relates to some recent threads and comments on whistle tuning by gruevy, Mike_Bill, celticpiper and others.
I’ve spent a fair amount of time blowing into tuners–or tuning apps–trying to figure out the relative octave tuning of various notes. The fact that pitch varies significantly with volume is annoying. Playing at an even volume and getting an average for each octave is the usual strategy.
It occurred to me recently that we may be discarding valuable information by doing this. If there is a well-defined relation between pitch and volume, we should be able to use that to correct for the resulting pitch variation in our measurements. This should give a better result than simply averaging. The recording itself has the information we need to construct that pitch-volume relation. I call this Pitch-Volume Tuning Analysis (PVTA).
PVTA is somewhat different than RTTA like McLeod’s Tartini, the McGee-Roxburgh Polygraph and more recent versions by Turner, Gordon, Eskin and Skiff (hope I didn’t omit anyone). PVTA uses the same type of pitch data input, but analyzes it in a different way. The RTTA Polygraph view combines pitch distribution information for all notes into a single view, and is extremely easy to use. PVTA, on the other hand, is more analogous to looking at a pair of notes through a microscope, moving the slide around and fiddling with the focus. And possibly going out to lunch 
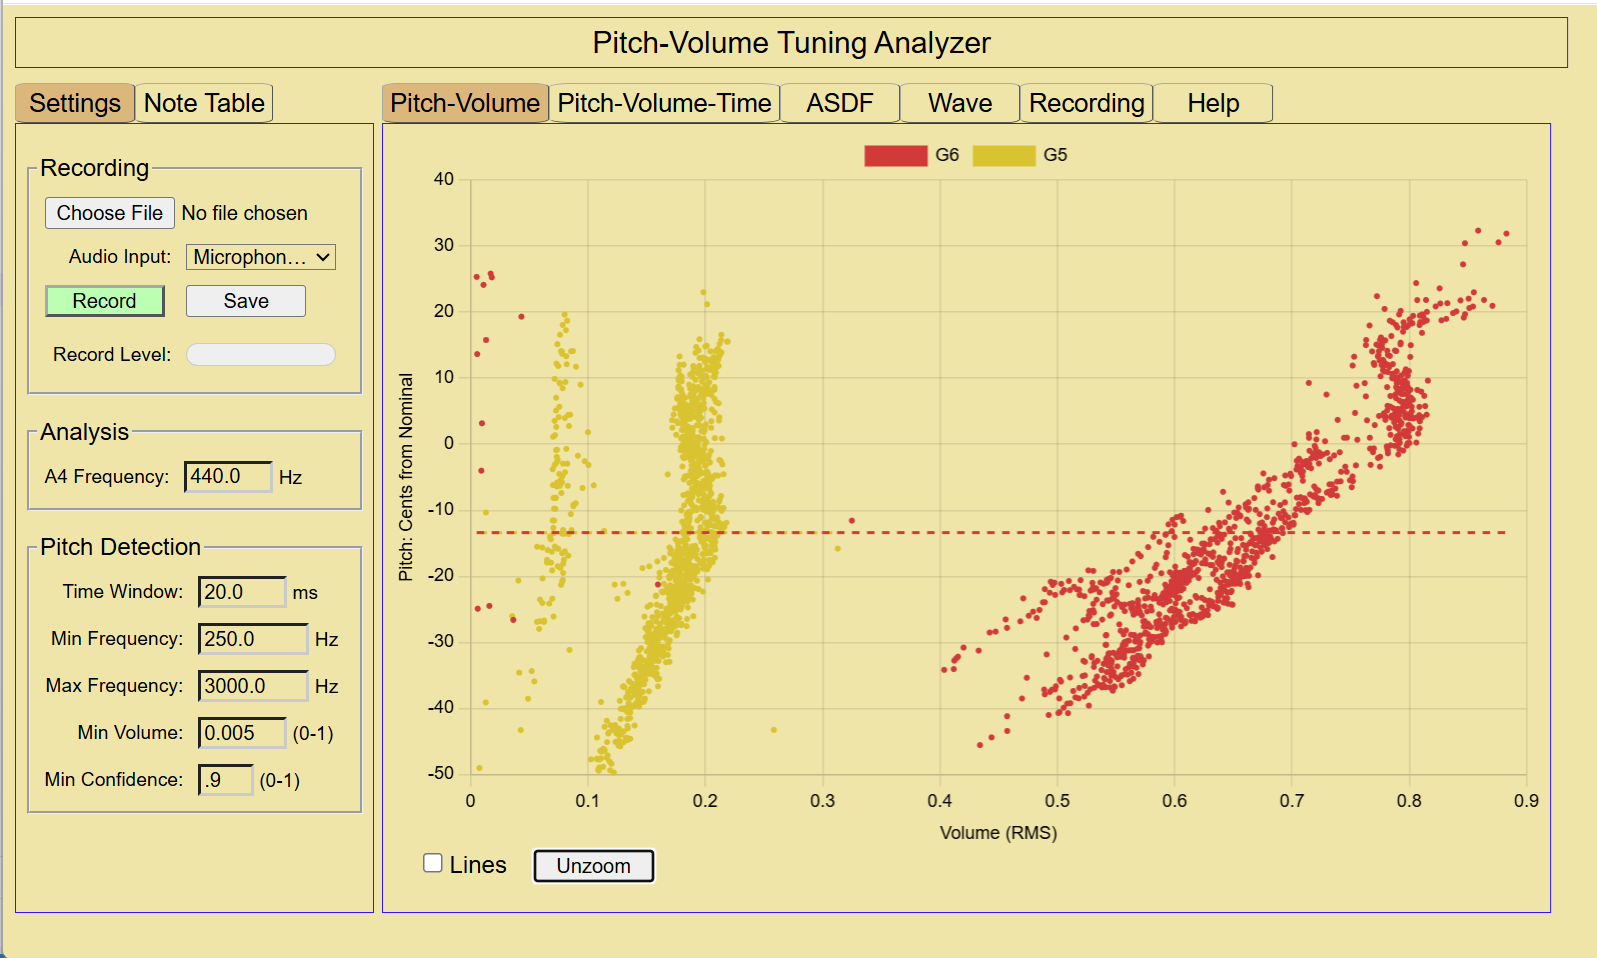
I have a web page that goes into more detail here. I’ve also made an online PVTA tool that you can access here.
Here’s an analysis I did by recording myself playing G4 and G5 on a flute and intentionally varying the volume of the notes widely.
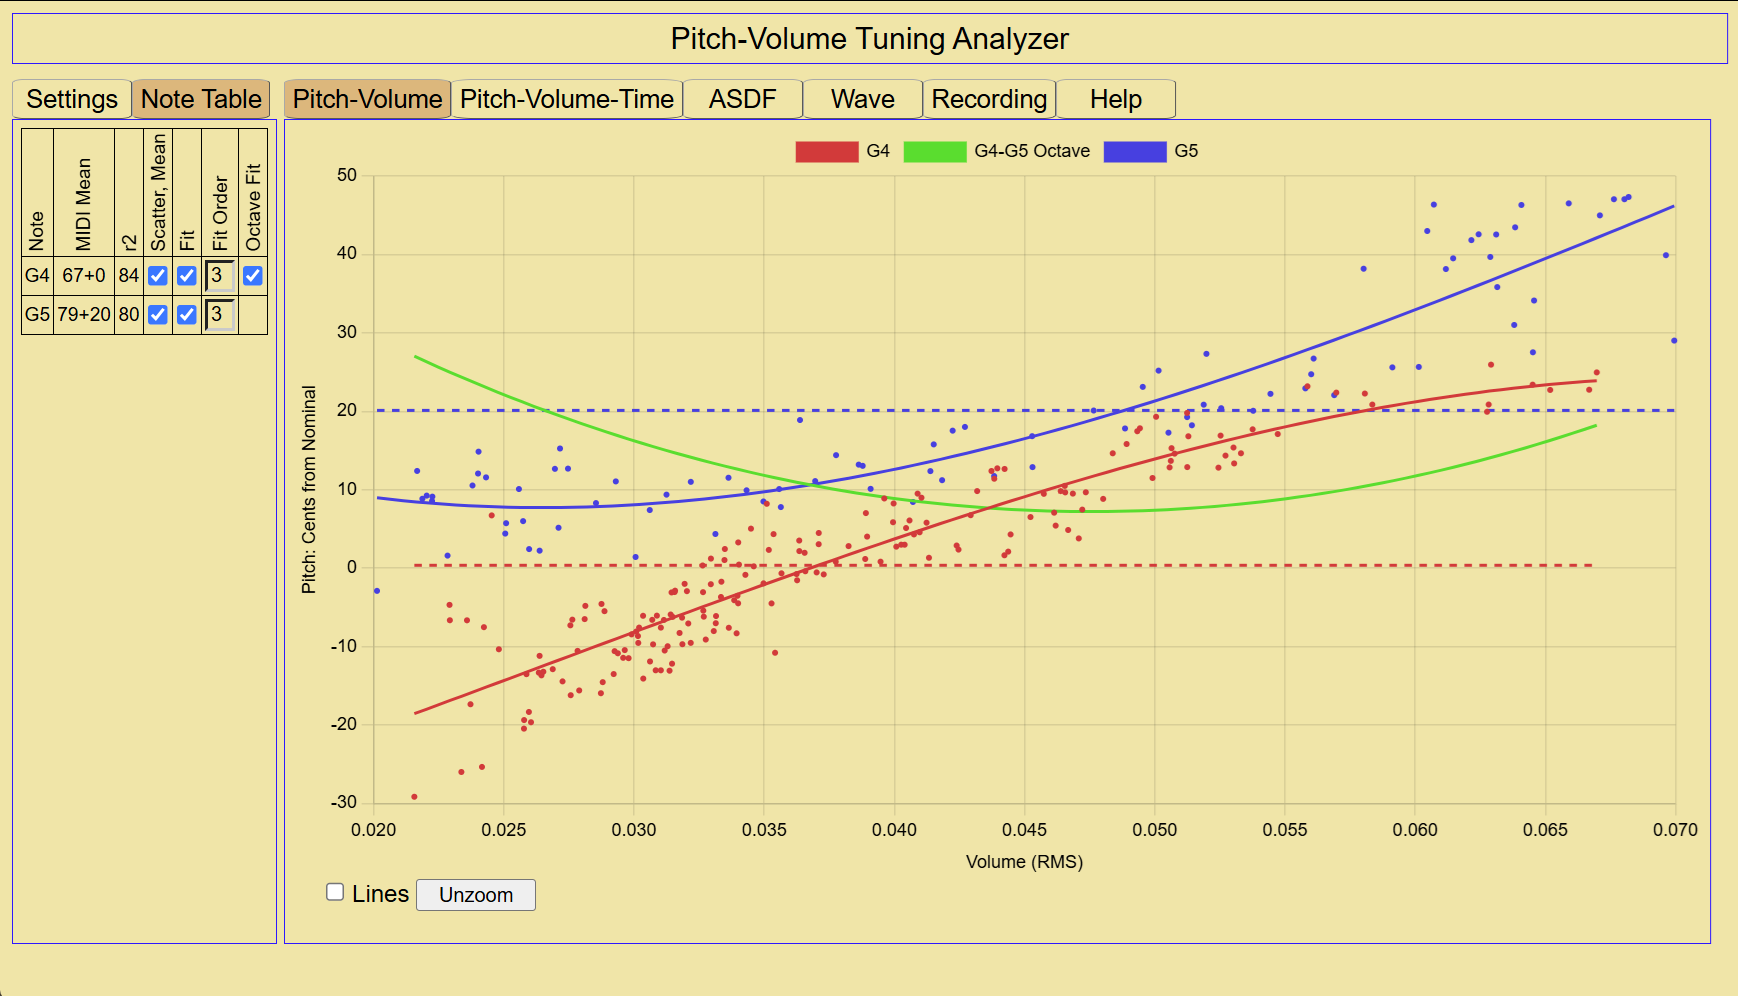
The pitch detection breaks the recording up into short chunks, and the volume and pitch (vs nominal) of each chunk is a point on the plot. Solid lines are regression-fitted curves, and the dashed lines are the mean values.
There is some additional information here–for instance, rather than just the octave stretch of 20 suggested by the mean values, the plot shows it is in fact a function of volume.
Here is the PVTA for G5/G6 on a Generation-like high D whistle:
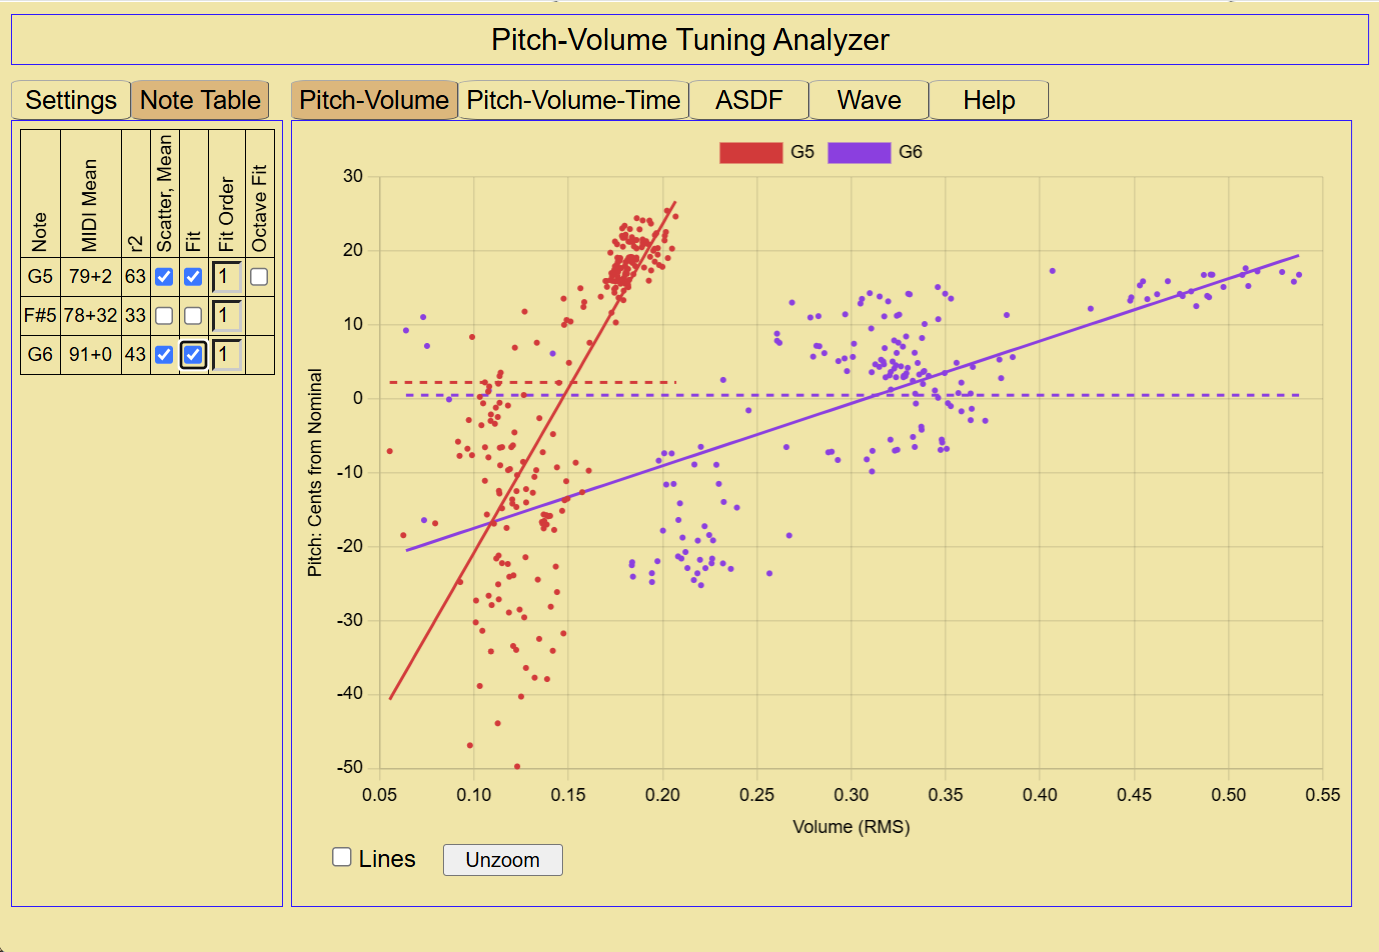
Analyzing the octave on whistles is more complicated, as the low octave is softer than the upper. I go into this in more detail on the web page in the section “Comparable Volumes”–basically you have to decide what volumes you want to compare. The PVT Analyzer has a feature to shift the lower series to the right to align it with the octave series. This was added after the above screenshot, but is a column called “Vol Offset” in the Note Table.
I know this is a rather niche topic, but I would be interested to hear people’s thoughts!
Cheers,
Rob